Dureza Software
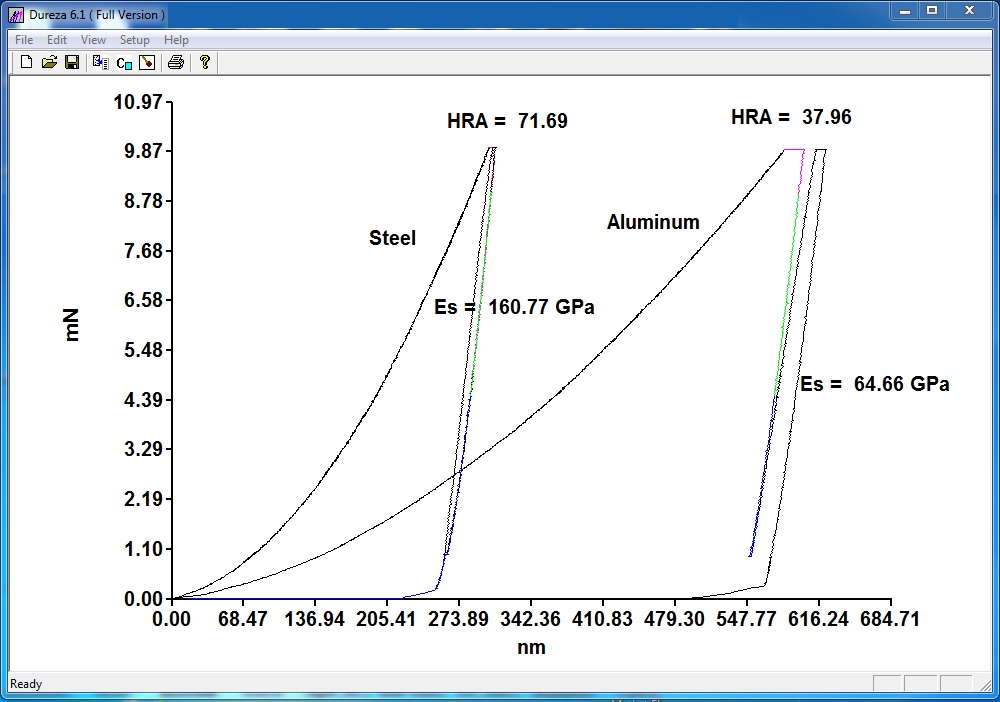
This is the offical website for the Dureza software. Dureza is used to do analysis of the load versus displacement curves from instrumented indentation machines (nanoindenters). Nanoindentation testers is a type of hardness testing machine that also measure the elastic modulus.
Our Dureza-mc software can be used an anaylze most raw testing machine load verse displacement data. It has special features not found anywhere else such as the ability to find the hardness of the indenter by indenting a material with a known hardness. It can also graph the change in elastic modulus along the unloading or reloading curve.
Nanomc Software
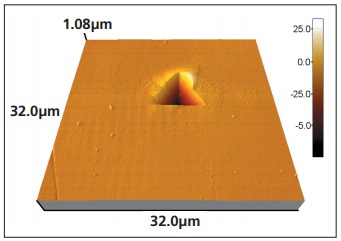
The atomic force microscope can be used tha assist in the analysis of indentations. The size of the indentation contact area and surface can effect the hardness and elastic modulus calculation. On some materials there is more pileup around the indentation which increase the contact area. If this contact area is ignored the hardness calculation will be greater than the actual hardness. The indenter tip shape could be rounded or damaged. The atomic force microscope can be used to make a 3D image of the indentation and surrounding area [ref 1]. The Nanomc software then measure the surface area, contact area with the pileup area [ref 2].
Hardness Testing
The size of the indentation can be used to determine the material hardness. A softer material will have a larger indent than a harder material. There are several standard hardness scales depending on the indenter used or method of calculation. The Dureza software has the Vicker hardness (HV), Oliver-Pharr hardness (H_op) and Rockwell hardness scale A (HRA).
Elastic Modulus
The elastic modulus of the material can be calculated from the slope of the unloading curve or reloading curve [ref 3]. As the indenter is lifted from the indent the material will push back on the indenter. The higher elastic material will have a steeper slope than a lower elastic modulus. The elastic modulus can also be measured from the reloading curve [ref 3].
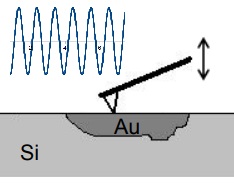
Contact Acoustic Resonance Dispersive Spectroscopy
The vibration of a tip tapping against the surface can be used to find the elastic modulus. A signal generator swepts to cantiliver frequency from 800 kHz to 1600 kHz in search of sharp increase in the amplitude of the cantilever vibration. This resonant peaks depend on the material elastic modulus. [ref. 4]
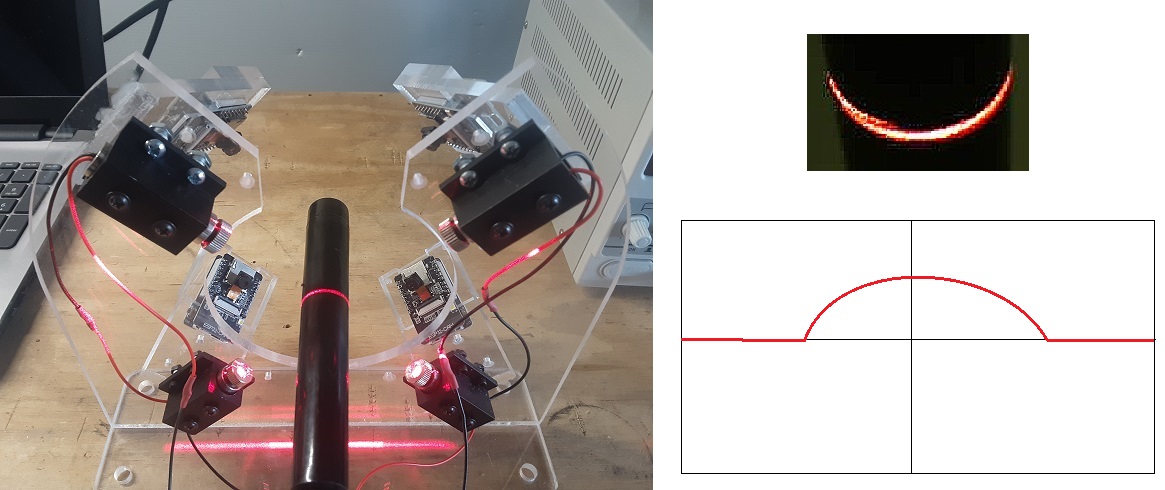
360 degree Laser Profiler for Tubes and Cylinders
REFERENCES
1. Computerized Image Analysis Software for Measuring Indents by AFMApril 2005 Project: Indentation Testing Accuracy and Calibration David J. Shuman
2. Combining Nanoindentation with Atomic Force Microscopy to Characterize the Mechanical Properties of each Microconstituent of Low Carbon Steel
3. CALCULATING THE ELASTIC MODULUS FROM INSTRUMENTED INDENTATION RELOAD CURVES
December 2005 David J. Shuman, André Costa, Margareth Spangler Andrade
4. AFAM_Spectrum MRS2006.pdf 2006 MRS Boston David J. Shuman, Bryan Huey